Do more with JavaScript tools
Click here, Press → key to advance.
Navigation
- [arrow keys] to go next and previous
- [mouse scroll wheel] to go next and previous
- [Ctrl or Command] + [+/-] to zoom in and out
- [touch gestures] for mobile devices
Agenda
- Developer Tools
- DOM Inspection
- Source Debugging
- Network performance
- JavaScript profiling
- Command Line API
- Remote Debugging
- Tools: Aardwolf, Weinre, Adobe Edge Inspect
JS is everywhere...

Image credit: JSFoo Bangalore 2012
Developer Tools
- Firebug
- Chrome Developer Tools
- Firefox Developer Toolbar
- Opera DragonFly
- Safari
- IE Deverloper Tools
Chrome Developer Tools
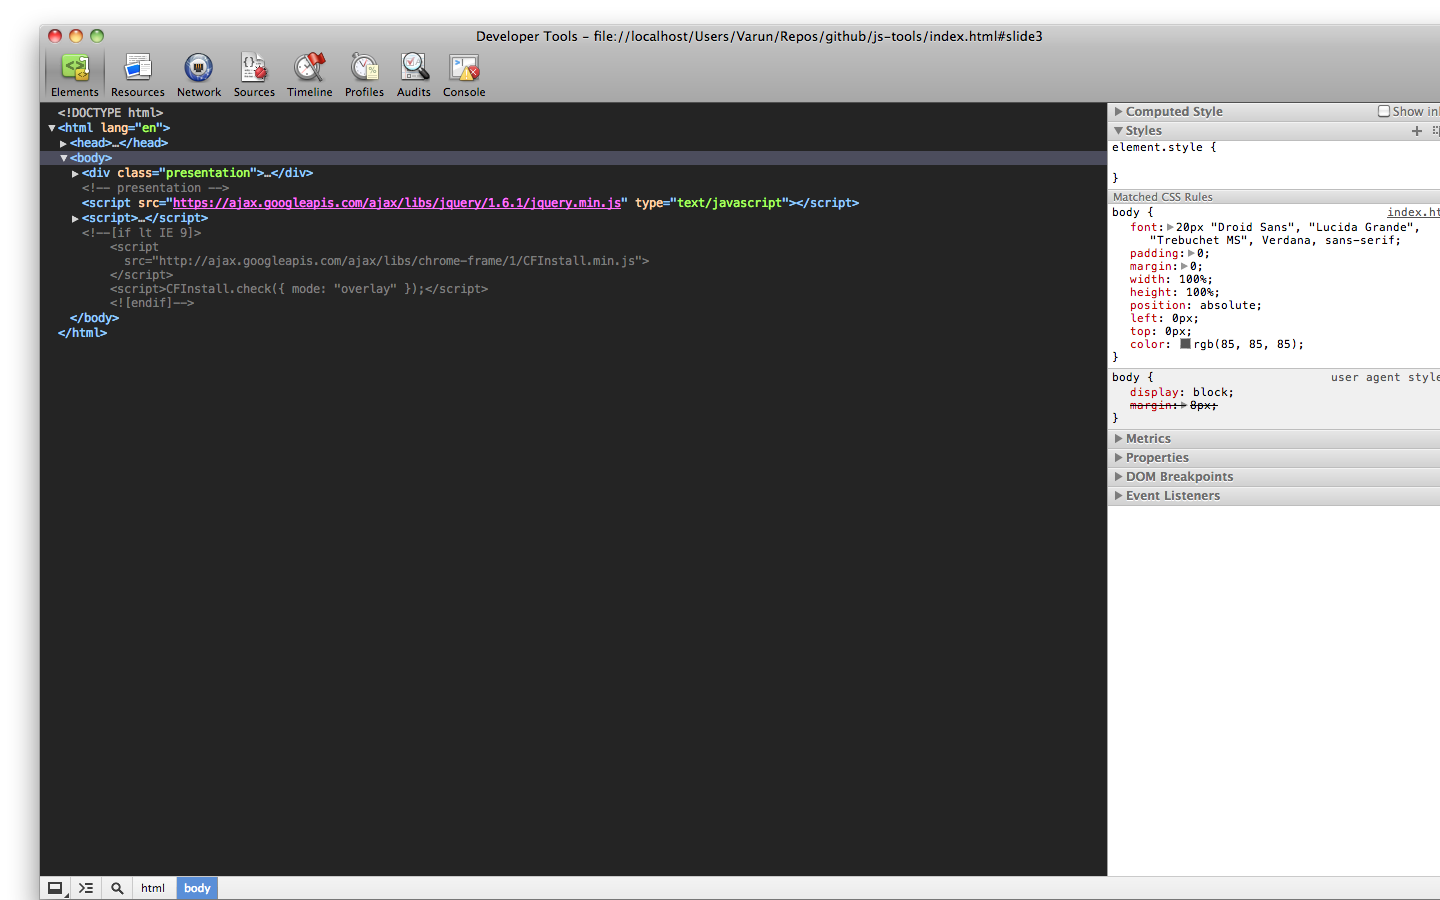
(Using custom CSS theme)
Firefox Developer Toolbar
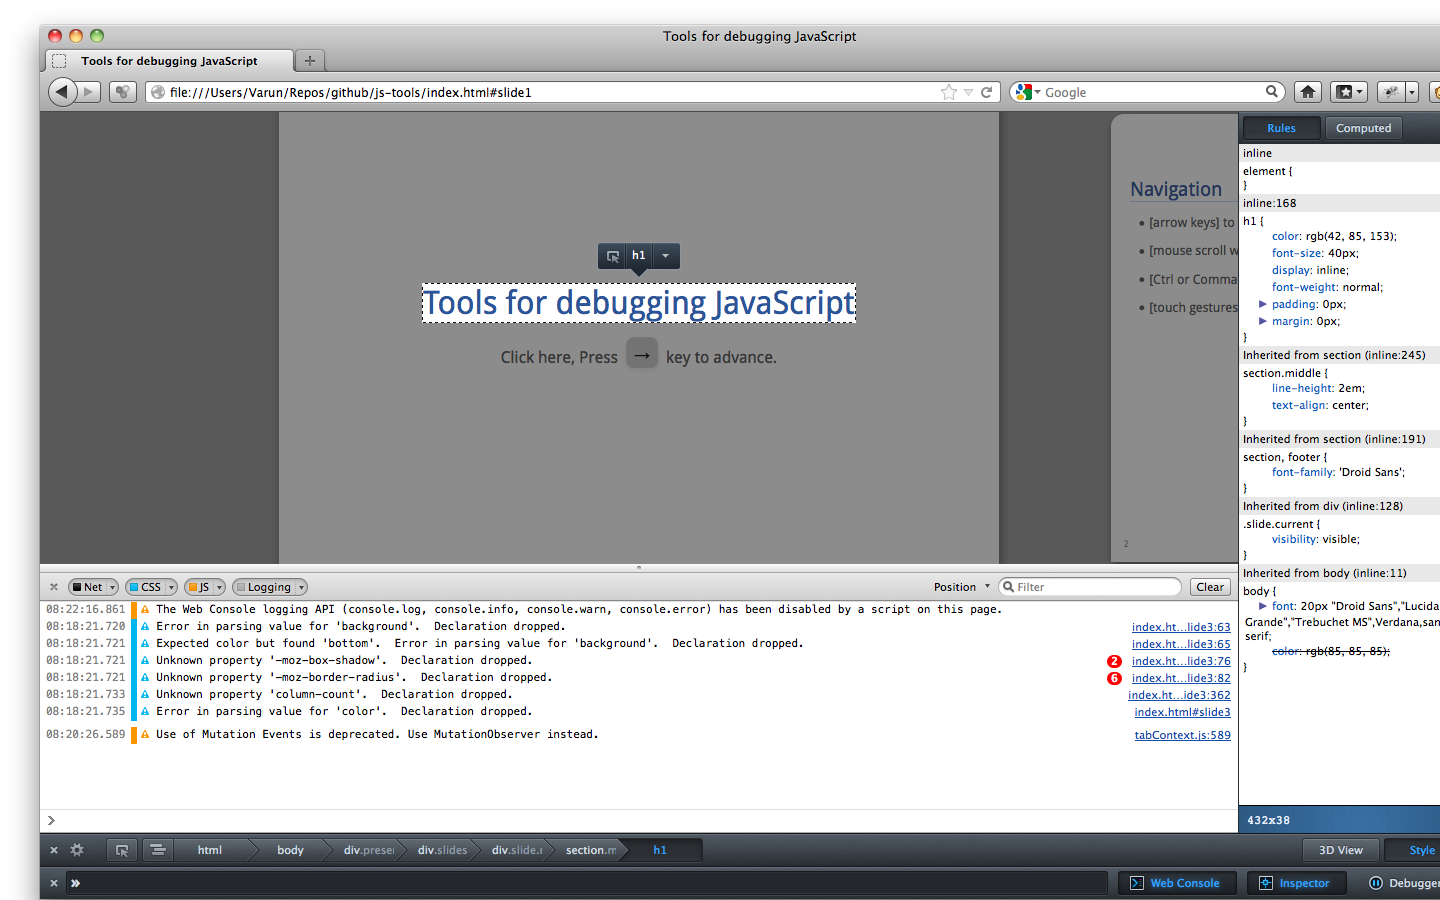
Firefox 3D Inspector (Tilt)
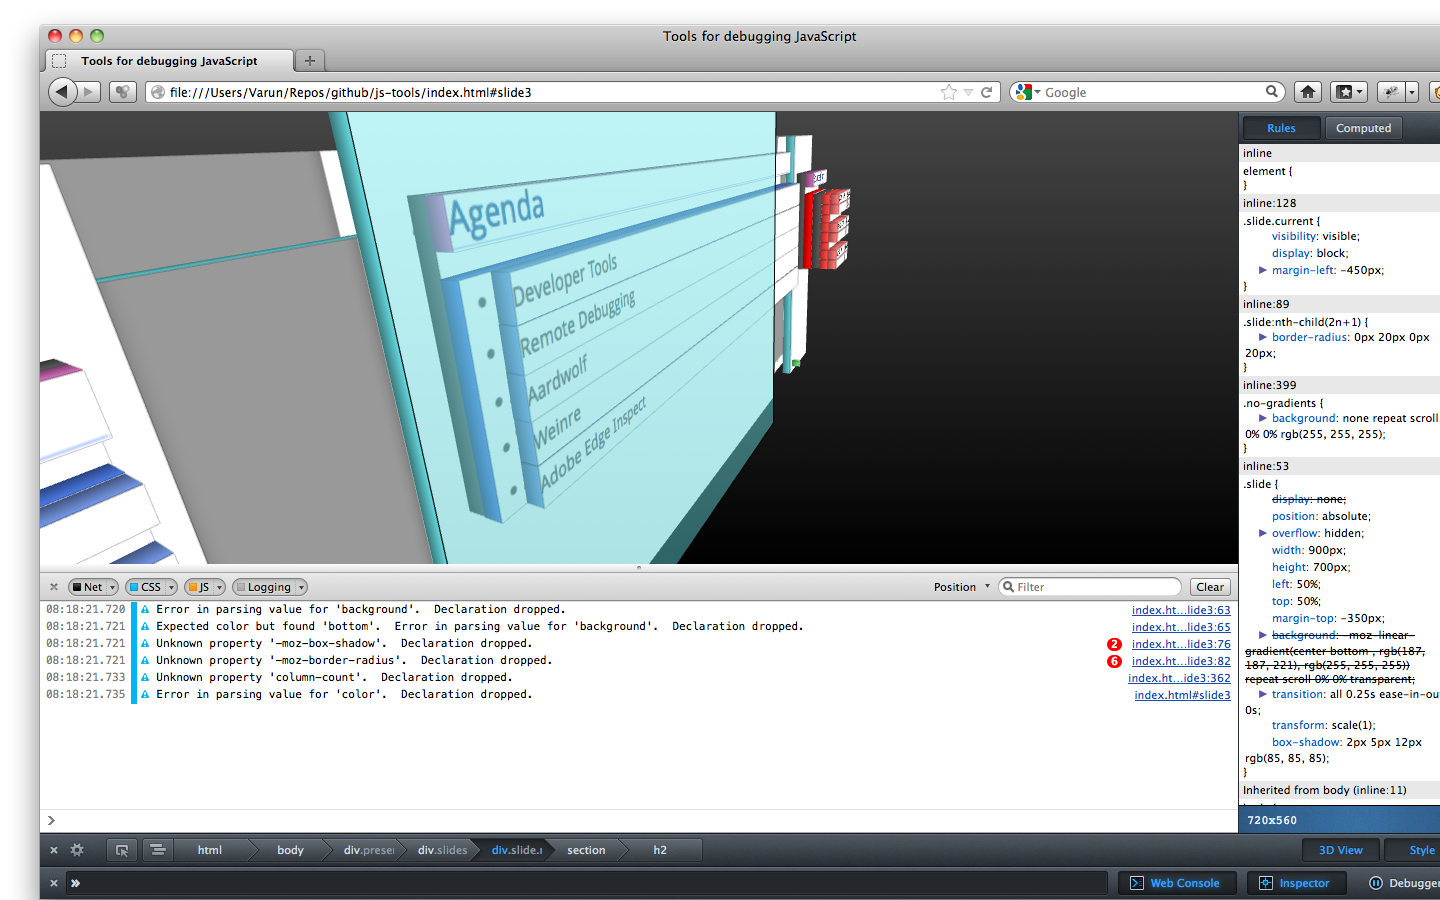
Tilt was originally built as an extension.
Firebug
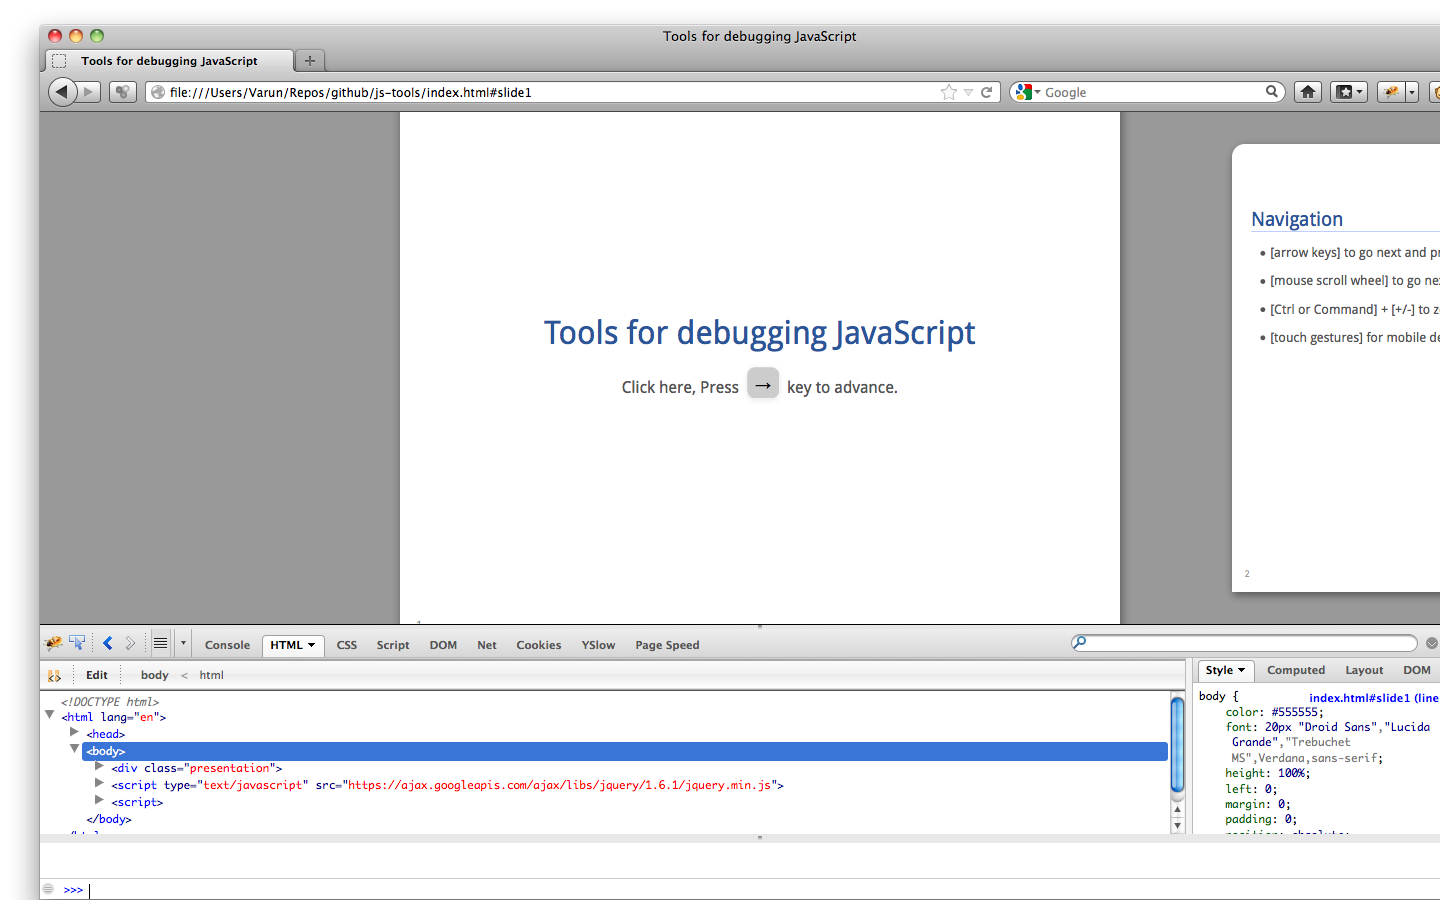
Opera DragonFly
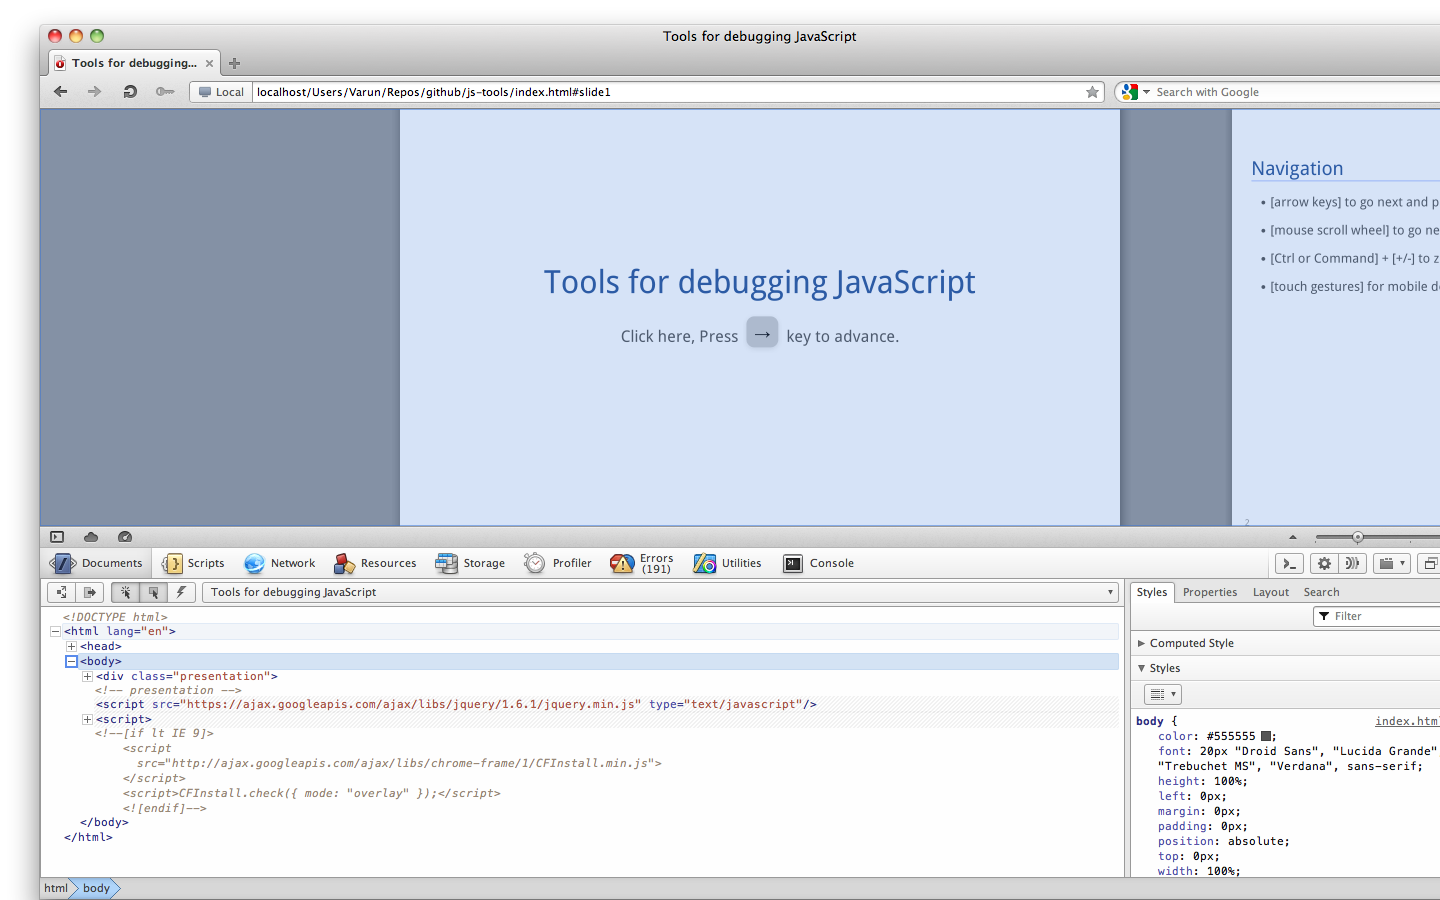
Chrome Developer Tools
Webkit based. Dev tools is also a web application. Chrome dev tools cheatsheet- Elements
- Resources
- Network
- Sources
- Timeline
- Profiles
- Audits
- Console
Chrome Developer Tools - Elements Panel
Lets you see everything in one DOM tree, and allows inspection and on-the-fly editing of DOM elements.
- DOM Tree (Drag & drop to reorder elements)
- Live edit DOM elemens - Attributes, text, HTML.
- Force Element state - :active, :hover
- Subtree modifications event, DOM breakpoints
- Event Listeners
- CSS styles - Autocomplete, add new styles, Box model
- XPath and much more...
Chrome Developer Tools - Resources Panel
Lets you inspect resources that are loaded in the inspected page. It lets you interact with HTML 5 Database, Local Storage, Cookies, AppCache, etc.
- Application Cache
- Local Storage
- Indexed DB
- Cookies
Chrome Developer Tools - Network Panel
Lets you inspect resources that are downloaded over the network.
- Timeline waterfall
- Initiator
- DOMContent event, Load event - Do UI heavy tasks on DOMContent.
- Export as HAR (HTTP Archive) - Awesomeness!!
- HAR viewer
- Integrate with your continuous build system - Phantom + YSlow
npm install -g yslow
phantomjs examples/netsniff.js http://www.varunkumar.me > output/snap-demo.har
yslow --info basic --format plain output/snap-demo.har
Chrome Developer Tools - Sources Panel
Lets you debug your JavaScript code.
- More like an IDE - Tab navigator, Syntax highlighting, shortcuts
- Source Maps, Revision Control, Pretty Print
- Call stack, Watch expressions,
- Breakpoints
- Conditional breakpoints
- DOM breakpoints
- XHR breakpoints
- Event Listener breakpoints
- Even, workers can be debugged
- Exceptions
- Stack trace on Console, Pause on next exception
- Printing stack traces - Error.stack, console.trace()
Chrome Developer Tools - Timeline Panel
Gives you a complete overview of where time is spent when loading and using your web app or page. All events, from loading resources to parsing JavaScript, calculating styles, and repainting are plotted on a timeline.
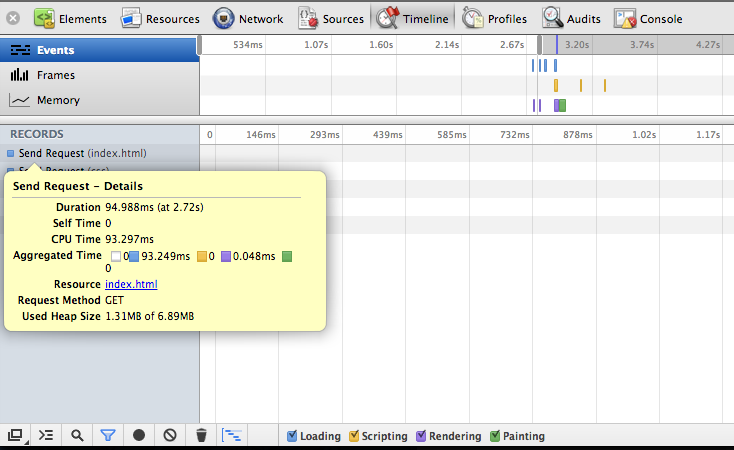
Chrome Developer Tools - Profiles Panel
Lets you profile the execution time and memory usage of a web app or page.
- JavaScript CPU Profile
- CSS Selector Profile
- Heap Snapshot
Chrome Developer Tools - Console
- Firebug Command Line API
- $(id) - Returns a single element with the given id.
- $$(selector) - Returns an array of elements that match the given CSS selector.
- $0, $1, $n(index)
- copy(obj) - Ex: copy($0)
- inspect(obj) - Ex: inspect($0)
- debug(fn), undebug(fn) - Adds / removes breakpoint to first line of fn
- monitor(fn), unmonitor(fn) - Logs all the calls to fn
- monitorEvents(obj), unmonitorEvents(obj)
Chrome Developer Tools - Customizations
- Disable Cache. This works *only if the dev tools is open*
- Disable JavaScript. Works only if the dev tools is open.
- Responsive Design, change user agent.
- Log XHRs
- Custom extensions -- Ex: CSS Diff
- Skin your Chrome web inspector
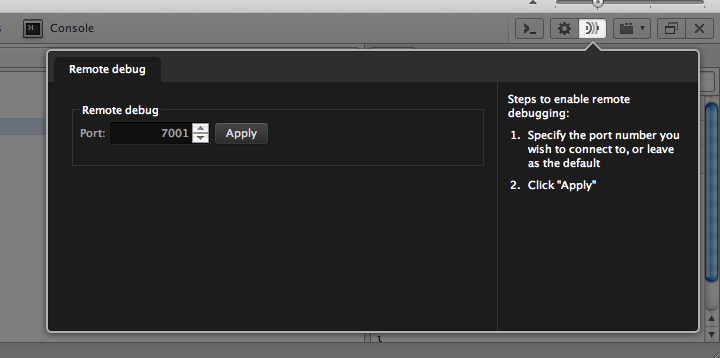
Chrome Developer Tools - Remote debugging
- Start the target browser with the flag: --remote-debugging-port 9222
- Port forwarding for Chrome for Android: adb forward tcp:9222 localabstract:chrome_devtools_remote
- From the debug client: http://<hostname>:9222, http://<hostname>:9222/json
Note the WS:// references in json output. That is the communication channel between dev tools and the web page.
Firefox Remote debugging
- about:config - devtools.debugger.remote-enabled = true
- On Android: toggle devtools.debugger.force-local to false, toggle devtools.debugger.remote-enabled to true
Opera Remote debugging
- First browser to support remote debugging
- Client listens on a port and the target connects to it for debugging
- about:opera on the target
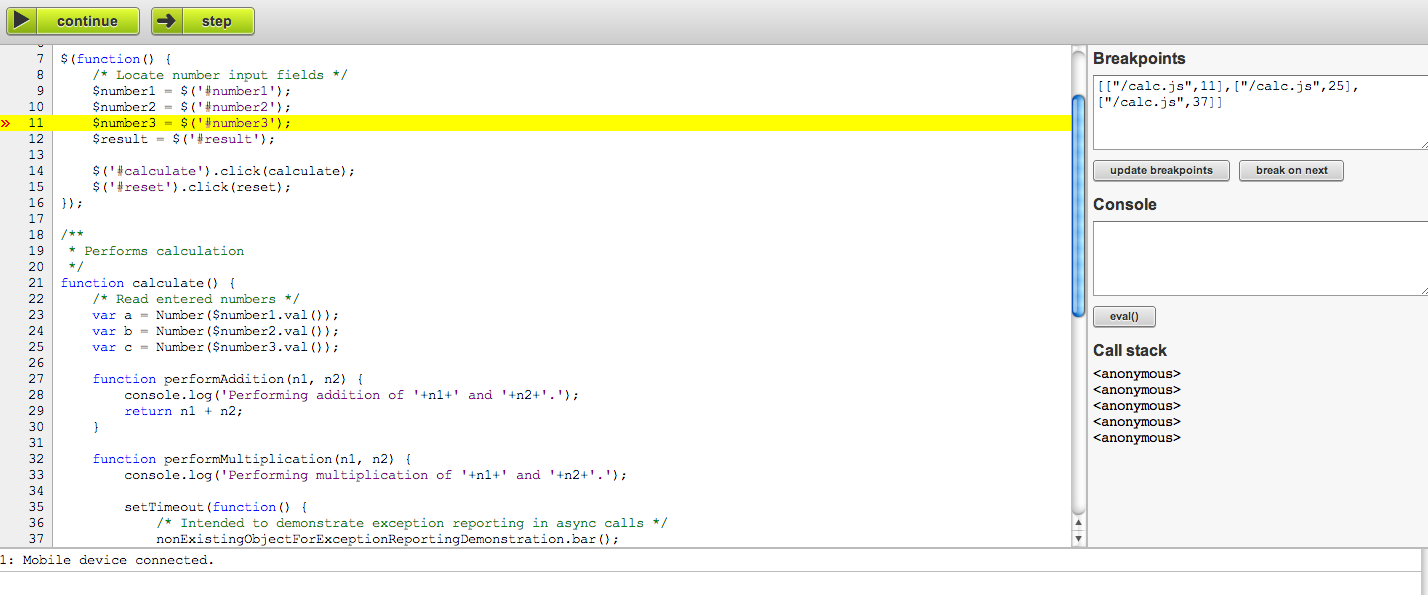
Aardwolf (JavaScript debugger)
- Remote JavaScript debugger for Android / iOS / Windows Phone 7 / BlackBerry OS 6+
- Powered by Node.js
- git clone git://github.com/lexandera/Aardwolf.git
- Source code proxying
- Code rewriter which injects debug info into your existing source code
Weinre (Remote inspector)
- WEb INspector REmote
- Debugger for web pages. Designed to work remotely.
- Uses webkit debugger interface.
- You can debug any target but the debug client must be run on webkit browsers only.
- Target and client communicates with each other through Weinre server (Java based)

Weinre
- Weinre Vs Webkit's web inspector
- No 'native' code, it's all JavaScript.
- Source level debug of JavaScript is not possible
- Multiple debug clients can debug the same debug target at the same time
- Inject target/target-script-min.js to the debug target
- Inject via bookmarklet
- Static loading of script. use window.WeinreServerURL
- Debug id for multi-user (#anonymous)
Adobe Edge Inspect
- Formerly known as 'Adobe Shadow'
- Remote Inspect (Uses Weinre hosted on Adobe Creative Cloud)
- Synchronized browsing
- Screenshots
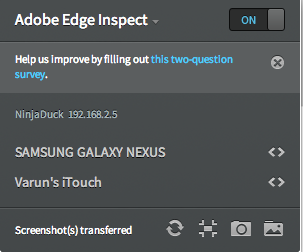
Adobe Edge Inspect
Some cool stuffs
Thank You!
Varunkumar Nagarajan (@varunkumar)
www.varunkumar.me